 flatline
MENU BAR MONITOR · APPLE SILICON
CPU, memory, network.
Nothing else.
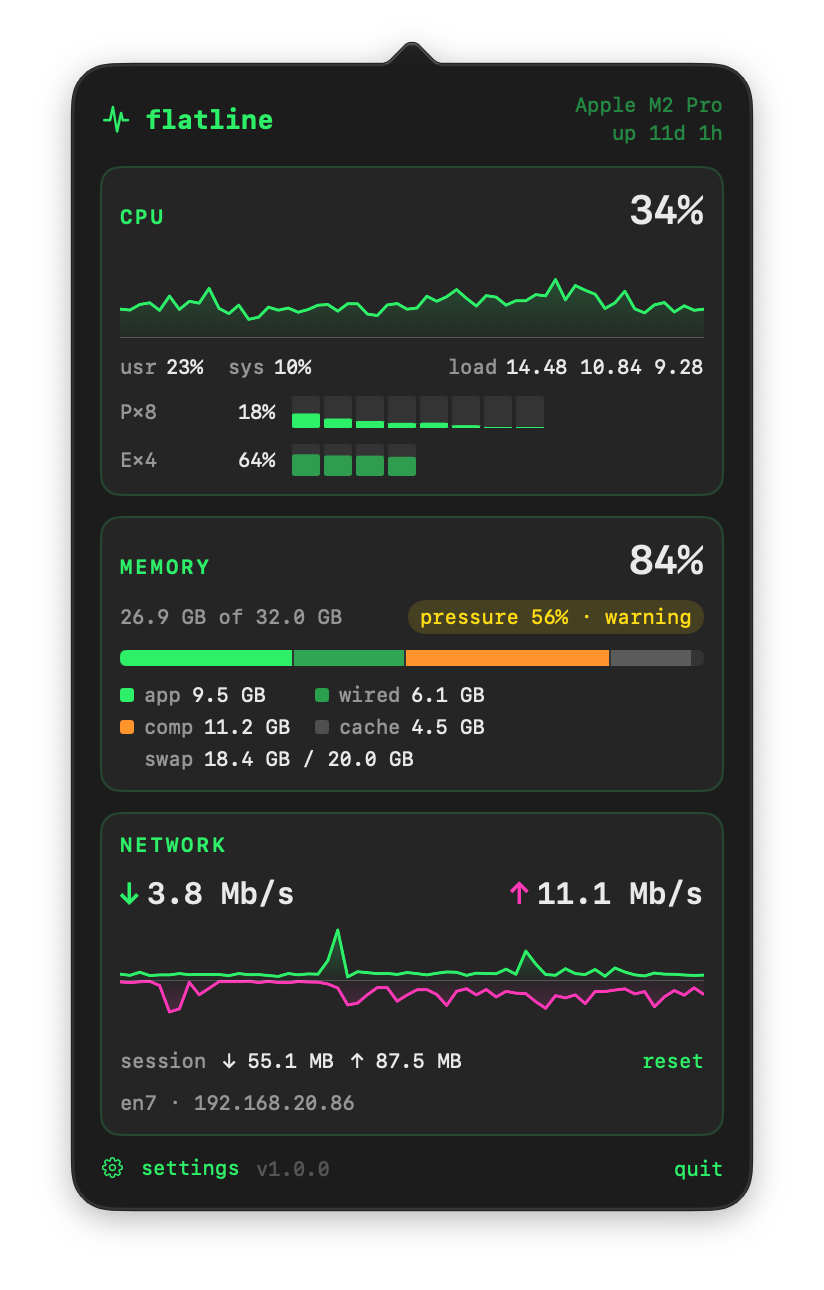
flatline runs only on Apple Silicon Macs with macOS 27. It shows CPU load for each Performance and Efficiency cluster, memory pressure the way macOS measures it, and network rates from 64-bit counters. It uses about 0.1% CPU itself.

brew install --cask banastas/tap/flatline
WHAT IT SHOWS
CPU
Total load with the user/system split, each Performance and Efficiency cluster, a per-core grid and the load average.
MEMORY
App, wired, compressed and cached memory with Activity Monitor's definitions, plus memory pressure and swap.
NETWORK
Live upload and download from 64-bit counters, so no false spikes after 4 GB, with session totals and your active interface.
RESOURCE USE
~0.1%CPU at idle, refreshing every second
13 MBof memory with the popover closed
1network request a day: the update check. No telemetry.
WHAT'S NEW IN 1.0.2
- A new app icon, in the look it now shares with the other banast.as apps
REQUIREMENTS
- macOS 27 or later
- Apple Silicon (M1 or newer)
- Signed and notarized by Apple
- Updates itself in the background